Viewing Model Details
The tabs on a planning model versus a Build It Yourself investment model.
Overview
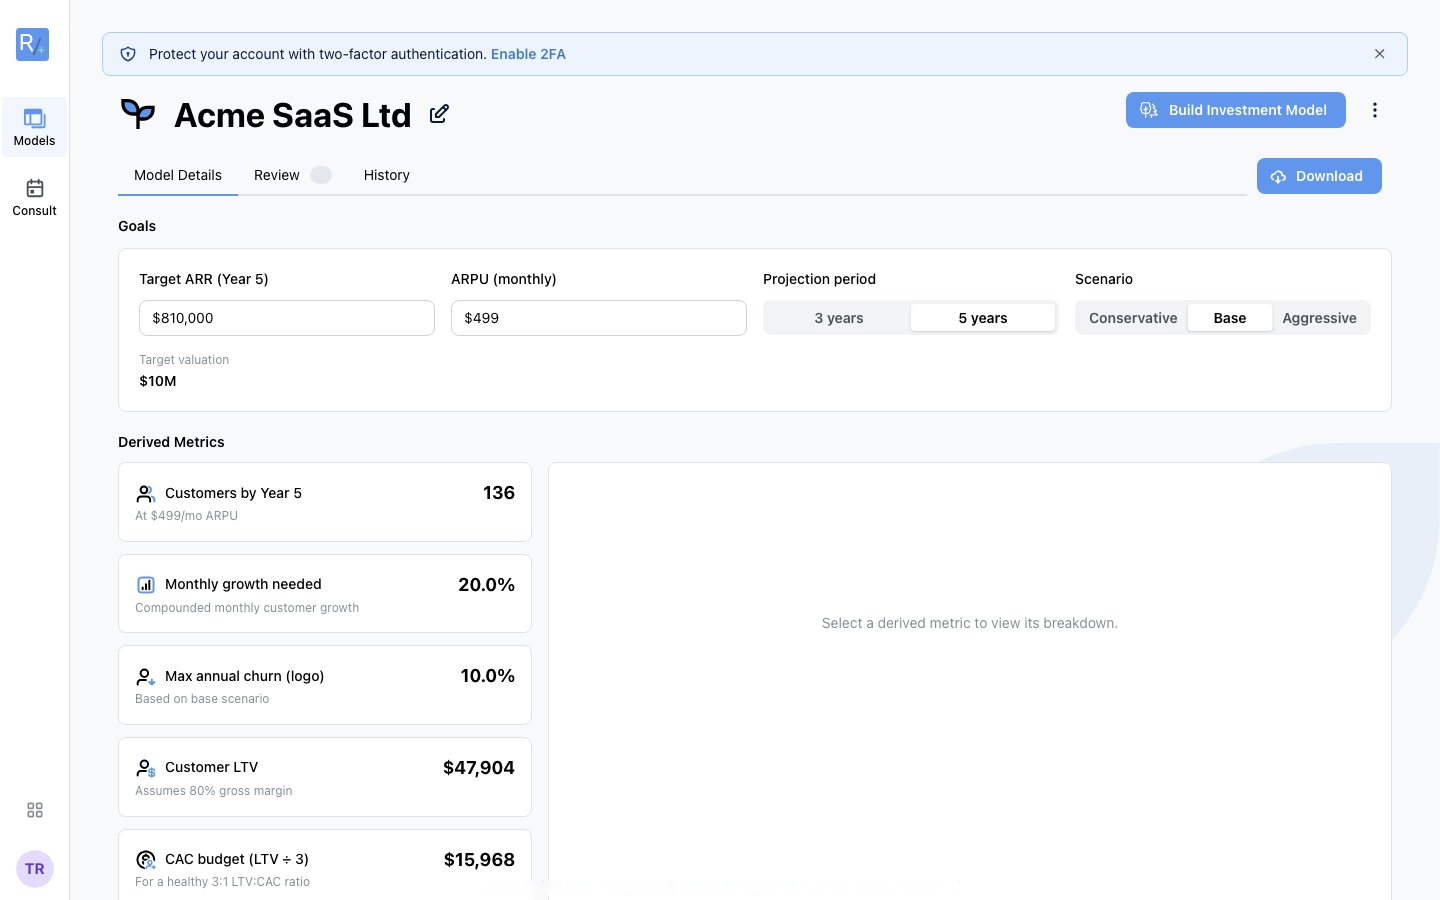
After creating a model, its details page is where you'll spend most of your time. The page looks different depending on tier: Planning models get a simple three-step flow, Investment models get a full tab bar. This guide explains both.
Each model has a unique URL: /financial-models/[model-id]. On your first visit a short model tour points out the main surfaces - click Skip tour to dismiss it.
Planning Models: Three Steps
Model Details → Review → Model
| Step | What's there |
|---|---|
| Model Details | Your goals and assumptions, the defensibility score, and the suggested raise |
| Review | Automatic checks - errors, warnings, and opportunities (the badge shows the count) |
| Model | The in-browser grid plus Download summary (PDF) and Excel buttons |
The Free Grid and the Padlocked Tabs
 The free grid: a full year-by-year P&L in accounting format. Above it, ghost tabs with padlocks - Actuals, Q&A Prep, Investor Memo, Rehearsal - are part of the Investment Model.
Clicking a padlocked tab opens the Build It Yourself explainer with an Upgrade to Build It Yourself button. Everything else on the page is fully usable on the free tier.
Investment Models: The Full Tab Bar
Assumptions · Review · Model · Q&A Prep · Investor Memo · Rehearsal · History
Plus, in the header: the Ask AI button, the Download dropdown, and the three-dot menu.
The Assumptions Tab
- Scenario - the Conservative / Base / Aggressive switcher (see Editing Your Model)
- Raise plan - your suggested raise, or what's blocking it (e.g. "This plan does not reach the Series A net revenue floor within the horizon")
- Information provided - how many fields you've answered (e.g. "1/28 fields answered"), with a Redo Questionnaire button
- Key Metrics - the headline drivers (for a marketplace: current monthly GMV, take rate, GMV per seller, average transaction value, active sellers and buyers)
- Section cards - Revenue, Growth, Customers, Unit economics, Costs, Headcount, Funding - each showing completion ("1 completed of 4") with expand and edit controls
The Model Tab
Two views, toggled at the top left of the grid:
- Sheet tabs run along the bottom: Dashboard, GMV Model (or your vertical's driver sheet), P&L (Monthly), P&L, Cash Flow, Balance Sheet, Unit Economics, Headcount, Cap Table, Exit & Returns, Sensitivity, Cohort Analysis
- A warning triangle on a tab means the Review report flagged something on that sheet
- The expand icon (top right) opens the grid full-screen
Model Charts
Scroll below the grid on the Dashboard tab for the chart set:
Reading the Numbers
- Statements: full dollars, thousands separators, negatives in parentheses -
($880,000) - Summary metrics: compact -
$18.8M,4.4x,34.5% - Extreme percentages display as n/m; ratios as A:B (e.g.
3:1)