Downloading Your Excel Model
Download the formula-linked workbook — and why unbalanced statements block export.
Overview
The Excel workbook is your data room in a file: a professionally formatted, formula-linked model ready to share with investors and analysts. The in-app grid and the download are built from the same engine, so what you see in Radley is exactly what you export.
Downloads by tier:
- Free (Planning) - Download summary (PDF): a watermarked one-page planning summary. The Excel button is visible but requires Build It Yourself.
- Build It Yourself (Investment) - the full Download menu:
 The Download dropdown on an investment model: Investor Memo (.pdf), Investor Deck (.pptx), Financial Model (.xlsx). For a raise-purpose model the memo and deck lead; for an operating model the workbook leads.
The Workbook, Sheet by Sheet
An investment workbook contains roughly 21-25 sheets depending on your business type, organised in two layers. (The examples below use a marketplace; SaaS gets an ARR Model instead of a GMV Model, hardware a Units Model, services a Capacity Model and Client Revenue, ecommerce an Orders Model and Inventory.)
The Analysis Layer (leads the workbook)
| Sheet | What it contains |
|---|---|
| Dashboard | The headline story: key metrics and summary charts |
| Unit Economics | Per-customer / per-order / per-unit economics, CAC payback, lifetime value |
| Valuation & DCF | Valuation cross-checks on the modeled exit |
| Sensitivity | An EBITDA matrix over your riskiest drivers - statement-linked, so it recalculates |
| Scenario Compare | Conservative / Base / Aggressive side by side |
| Cohort Analysis | Retention triangles by cohort (e.g. buyer and seller retention for a marketplace) |
| Benchmarks | Your metrics vs stage-appropriate bands with computed verdicts: Metric / Your Value / Healthy Band / Verdict / Stage - verdicts read "On benchmark", "Watch", or "Below band" |
| Use of Funds | What the raise buys |
| Milestone Bridge | The milestones between this round and the next |
| Raise Comparison | How your round compares across sizing options |
The Statements & Schedules Layer
| Sheet | What it contains |
|---|---|
| Model Inputs | Every assumption in one place - change here, workbook recalculates |
| Driver sheet (GMV Model, ARR Model, Units Model, Capacity Model, or Orders Model) | Your vertical's revenue engine, month by month |
| P&L Monthly / P&L Annual | Income statements over the full 60-month horizon |
| Working Capital | Receivables, payables, and (for marketplaces) funds held in trust |
| PP&E Schedule | Capex and depreciation |
| Balance Sheet | Assets, liabilities, equity - with an explicit balance check |
| Cash Flow | Operating, investing, financing - and ending cash |
| Headcount & Costs | Team plan and loaded costs |
| Cap Table | Ownership through your modeled rounds |
| Exit Valuation | Exit scenarios, MOIC and IRR |
| Inventory (hardware/ecommerce) | Stock, purchases, and the cash they tie up |
Everything is formula-linked - no hardcoded results. An analyst can trace any output back to Model Inputs, which is precisely what diligence does.
How to Download
- Open your model and go to the Model step/tab
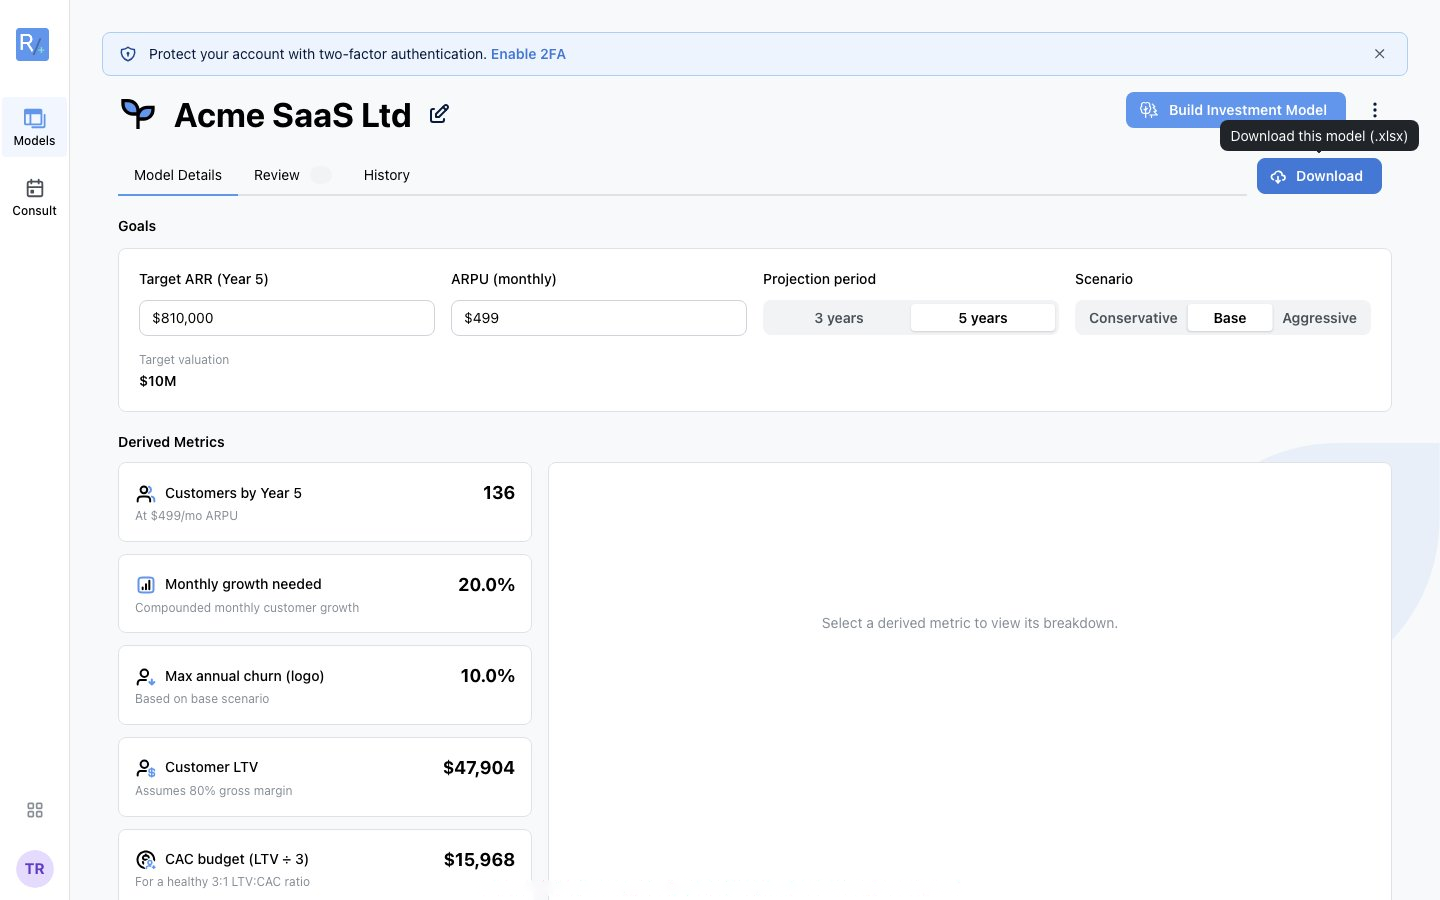
- Click Download and choose Financial Model (.xlsx)
- The workbook generates from your active version and current scenario, then saves to your browser's download folder
Note: If the Review tab shows accounting errors (e.g. an unbalanced balance sheet), fix them first - Radley won't export statements that don't stand up.
Working With the File
- Excel, Google Sheets, and Numbers all open it; formulas are standard
- Re-download after edits - the file is a snapshot, and your in-app model stays the source of truth
- Version your filenames when sharing (
HarborVine-Model-2026-08-Seed.xlsx) so diligence threads don't fork